Introduction/Background
Due to the increased proficiency of AI in generating images, our team decided that an impactful topic for our project would be in detecting these synthetic images.
A paper that details a similar goal “Detection of AI-Created Images Using Convolutional Neural Networks”[1], discusses the growing concern of image generation, and the methods that they implemented in addressing it. Simply stated, the paper details the experience in creating a tool capable of “making a binary decision over an image, asking whether it is artificially or naturally created”[1]. There has been notable success in our topic prior to recent AI improvements. In 2022 similar detection models were studied, credited with achieving up to “98% accuracy in detecting Deepfakes”[2]. However, stats such as these relied heavily on alignment between the train and test sets, as using “unrelated datasets drops the performance close to 50%”[2].
Dataset: https://www.kaggle.com/datasets/birdy654/cifake-real-and-ai-generated-synthetic-imagesOur model will be trained on the “Krizhevsky & Hinton CIFAR-10” dataset, which contains 60,000 artificial images and 60,000 natural ones. This set is commonly accepted in training models to classify image generation.
Problem Definition
As AI-generated images become increasingly realistic, distinguishing them from real images has become a challenge. The potential misuse of such images to spread misinformation or perform identity theft raise ethical concerns. Since there's no universal legal requirement for AI-generated images to be labeled, it's crucial to develop automated methods for detecting and classifying them. We hope to provide a reliable tool for verification of digital media.
Methods
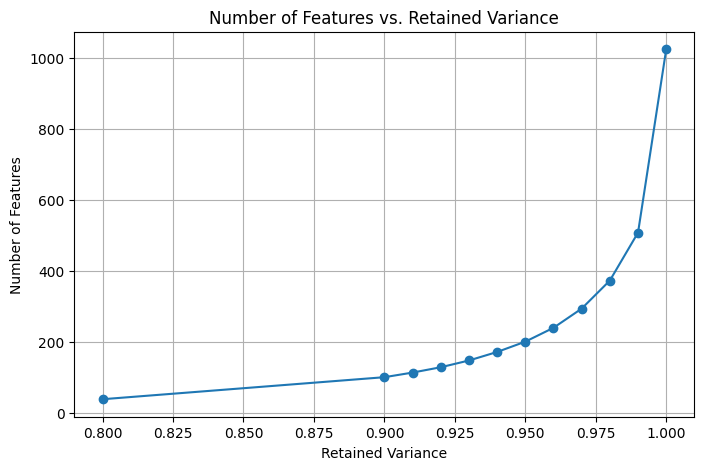
To preprocess our data, we resized and grayscaled all images to ensure consistency and reduce computational complexity. This step was important to introduce uniformity among the dataset and help speed up the convergence of our model. Given that each pixel represents a feature, the image data was high-dimensional and it was essential to use dimensionality reduction. We used PCA as our dimensionality reduction technique. We weighed the differences between PCA and SVD but the paper “PCA based image denoising”[3] biased us toward PCA due to it’s ability to preserve “only the several most significant principal components, [so that] the noise and trivial information can be removed”. It was important to maximize variance so that only the most information features that could be used to distinguish between real and synthetic images. Additionally, focusing on principal components helped mitigate the risk of overfitting.
For classification, we employed support vector machines (SVMs). SVMs are effective in high-dimensional spaces and are capable of finding an optimal hyperplane without overfitting. This method also relies on maximizing the margin between classes, which was crucial due to the nature of our data. These images had a large number of irrelevant features and were not necessarily linearly separable, even after dimensionality reduction. By utilizing SVMs, we were able to classify high-dimensional data while minimizing the risk of overfitting.Our second model was a Random Forrest. This was chosen due to their success in classification tasks. Also, they prove beneficial in not succumbing to overfitting due to their use of multiple decision trees. Also, they are very robust to noise and nonlinear data so we felt that would be a good characteristic for our image data.
Our third model is a Convolutional Neural Network. This was chosen due to their design for grid-like image data. Also, CNN's are designed to have automatic feature extraction to identify the most useful features so it makes the classifications more accurate. Also in terms of training time they show to be faster than SVM's so that is an advantage that we want to capitalize on.
Results and Discussion
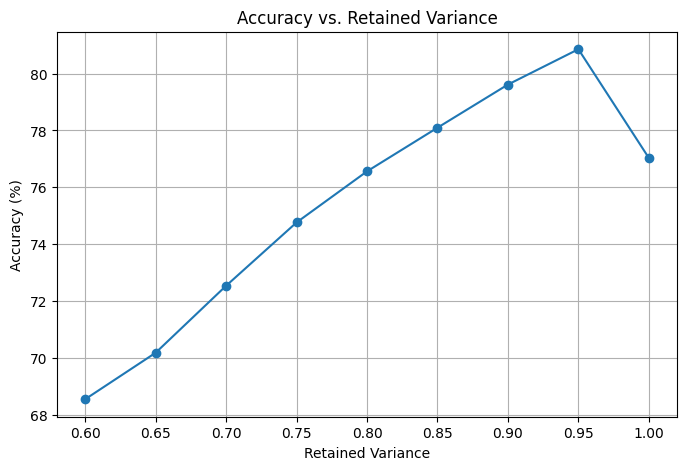
SVM Model
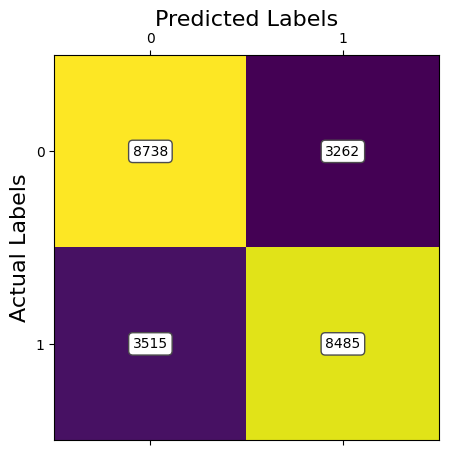

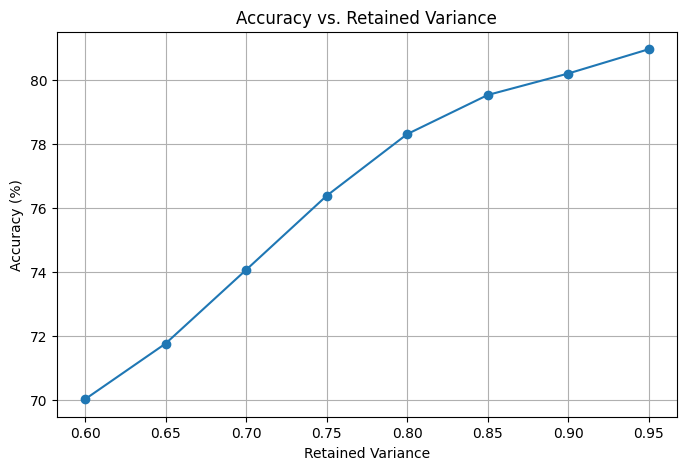
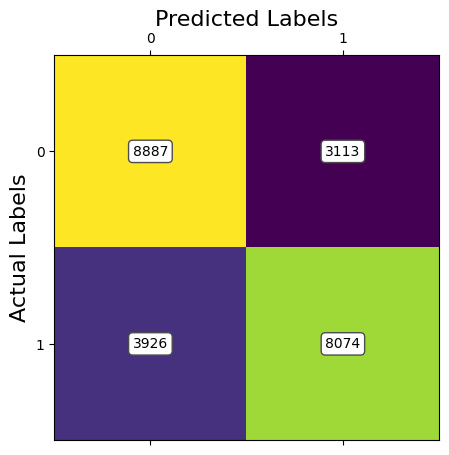
ANALYSIS: The results of the first model of SVM using Image Resizing and PCA to preprocess the data shows promising results, however, this model takes a long time to train, especially for higher retained variances. Currently, with 95% of retained variance with PCA, we are achieving an accuracy of around 81%.
Random Forest Model


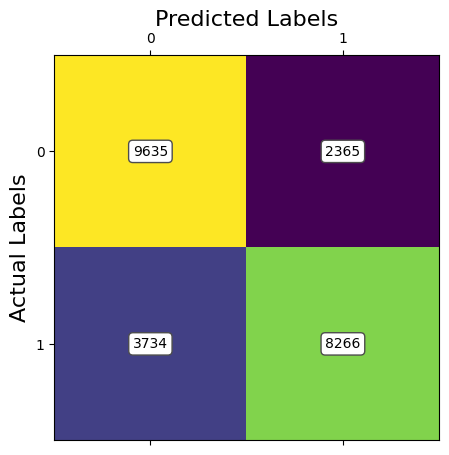
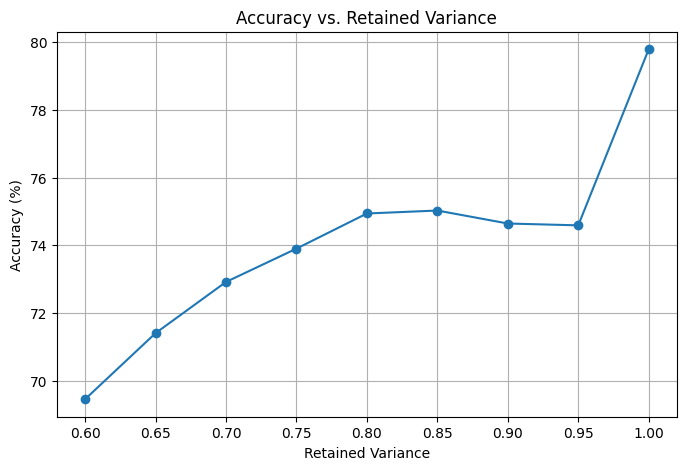
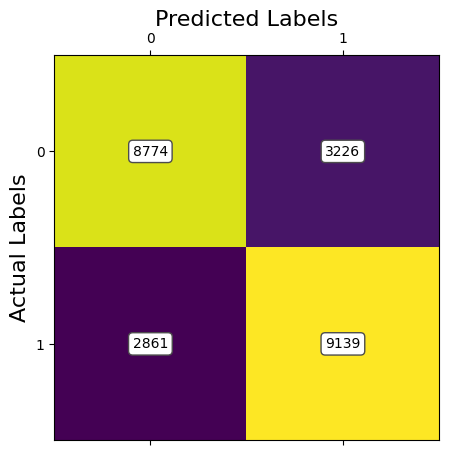
ANALYSIS: The results of the second model of RF using Image Resizing and PCA to preprocess the data show less promising results. The accuracy values were lower than compared to SVM. The spike in the accuracy at 100% retained variance can be attributed to the exponentially greater amount of features being inputted. This allows the RF model to have more options of features when choosing the random subset. This leads to the higher accuracy. RF models are good for classification but not good for image data. Currently, with 95% of retained variance with PCA, we are achieving an accuracy of around 74.6%. However, the training time was much lower, even for higher retained variances.
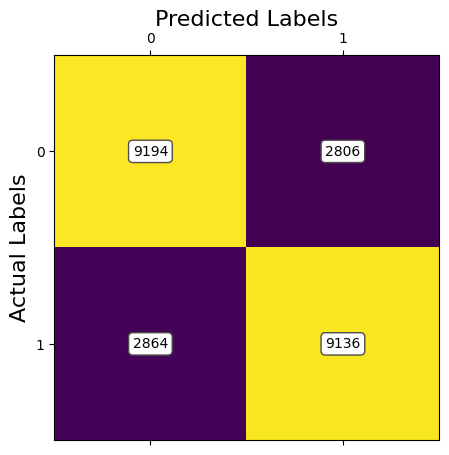
CNN Model
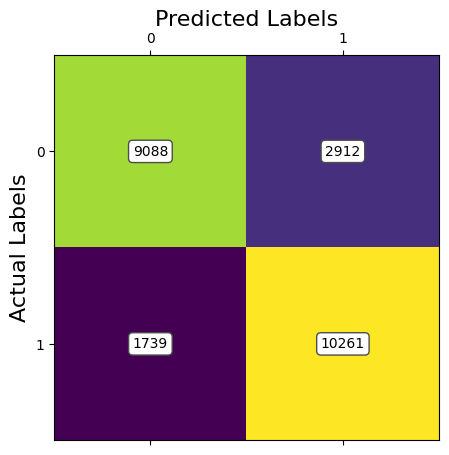
ANALYSIS: The results of the third model of CNN using Image Resizing and PCA to preprocess the data shows good results. The accuracies are at the level of the SVM model. However, in contrast to SVM, the CNN model had lower training times. The drop in accuracy at 100% retained variance is due to the greater amount of features present that don't give useful information. This can be attributed as noise which doesn't help a CNN. Currently, with 95% of retained variance with PCA, we are achieving an accuracy of around 81%.
Cross Model Comparisons
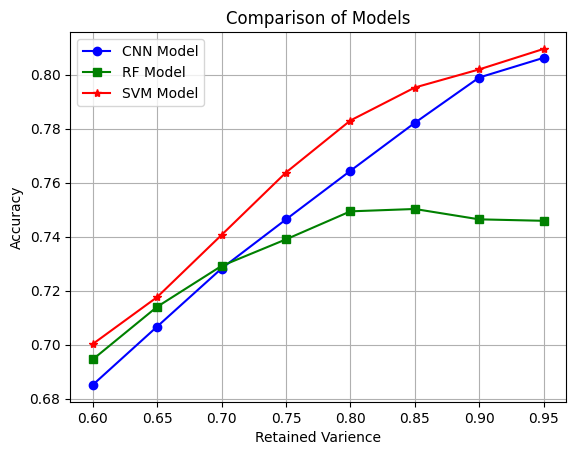
ANALYSIS: Comparing all three models shows how SVM and CNN outperformed the RF model. When comparing SVM and CNN, during our implementation it was clear that CNN took a shorter training time. This can prove useful when dealing with large datasets and needing to work quickly
NEXT STEPS: If we were to continue work on this project in the future, our next steps would include adding additional data preprocessing methods, as well as alternate feature selection methods to see if that could improve our accuracy to reach higher values. We decided this would be a good next step due to our different models peaking around the same ranges in performance. Additionally, we thought it would be interesting to see if we could use a different data set to train to see if better results will emerge, or if our model is particularly effective on this specific dataset. In terms of future work on this project, we would also like to publish the overall DeepFake Detector Model as a public website, so that people could use our work in testing if images are Ai generated or not.
References
[1] F. Martin-Rodriguez, R. Garcia-Mojon, and M. Fernandez-Barciela, "Detection of AI-Created Images Using Pixel-Wise Feature Extraction and Convolutional Neural Networks," Sensors, vol. 23, no. 21, p. 8846, Nov. 2023. Available: https://pmc.ncbi.nlm.nih.gov/articles/PMC10674908/.
[2] A. Tolosana, R. Vera-Rodriguez, J. Fierrez, A. Morales, and J. Ortega-Garcia, "Deepfake Detection: A Systematic Literature Review," *IEEE Access*, vol. 9, pp. 9915–9945, 2021. Available: [https://ieeexplore.ieee.org/document/9721302](https://ieeexplore.ieee.org/document/9721302).
[3] Y. Murali Mohan Babu, Dr. M.V. Subramanyam, Dr. M.N. Giri Prasad, "PCA based image denoising", Signal & Image Processing : An International Journal (SIPIJ) Vol.3, No.2, April 2012
Award Eligibility: YES, We would like to opt in